Be Author Be Seller Become Member now and avail new Offers!
.com Category
Login
kachhua
Redirecting you.... kachhua

Log in

Mobile No / Email


Password


or
Sign Up
kachhua
Redirecting you.... kachhua

Registration

Already have an account? Login Here

Mobile No.
Name
Email
Password

or Signup with
Cart (0 Items)
Subtotal: $0.00
Your cart is empty!


Statistics and Data Science in R : Learn By Example

This course is an introduction to Data Science and Statistics using the R programming language. It covers both the theoretical aspects of Statistical concepts and the practical implementation using R.
Statistics and Data Science in R : Learn By Example
  • ₹ 2999
logo
: Online Course
: English
: Loonycorn
Displaying 1-4 of 4 result(s).

About Course

  • This course is a gentle yet thorough introduction to Data Science, Statistics and R using real life examples. 

    Gentle, yet thorough: This course does not require a prior quantitative or mathematics background. It starts by introducing basic concepts such as the mean, median etc and eventually covers all aspects of an analytics (or) data science career from analysing and preparing raw data to visualising your findings. 

    Data Science, Statistics and R: This course is an introduction to Data Science and Statistics using the R programming language. It covers both the theoretical aspects of Statistical concepts and the practical implementation using R. 

    Real life examples: Every concept is explained with the help of examples, case studies and source code in R wherever necessary. The examples cover a wide array of topics and range from A/B testing in an Internet company context to the Capital Asset Pricing Model in a quant finance context. 

    What's Covered:

    Data Analysis with R: Datatypes and Data structures in R, Vectors, Arrays, Matrices, Lists, Data Frames, Reading data from files, Aggregating, Sorting & Merging Data Frames

    Linear Regression: Regression, Simple Linear Regression in Excel, Simple Linear Regression in R, Multiple Linear Regression in R, Categorical variables in regression, Robust regression, Parsing regression diagnostic plots

    Data Visualization in RLine plot, Scatter plot, Bar plot, Histogram, Scatterplot matrix, Heat map, Packages for Data Visualisation : Rcolorbrewer, ggplot2

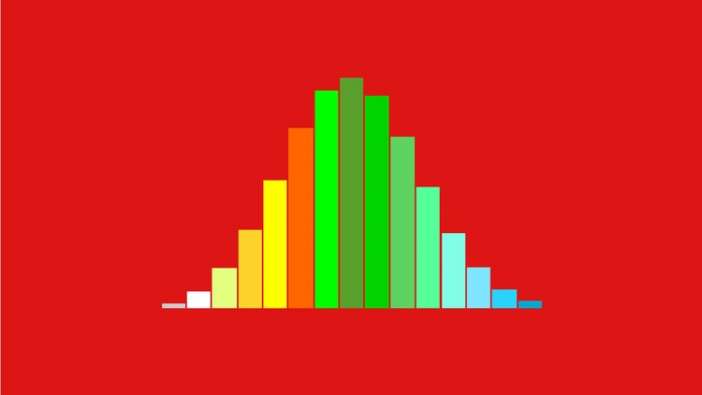
    Descriptive Statistics: Mean, Median, Mode, IQR, Standard Deviation, Frequency Distributions, Histograms, Boxplots

    Inferential Statistics: Random Variables, Probability Distributions, Uniform Distribution, Normal Distribution, Sampling, Sampling Distribution, Hypothesis testing, Test statistic, Test of significance

Topics covered in this course

What you will get from this course?

    • Harness R and R packages to read, process and visualize data
    • Understand linear regression and use it confidently to build models
    • Understand the intricacies of all the different data structures in R
    • Use Linear regression in R to overcome the difficulties of LINEST() in Excel
    • Draw inferences from data and support them using tests of significance
    • Use descriptive statistics to perform a quick study of some data and present results
    • No prerequisites : We start from basics and cover everything you need to know. We will be installing R and RStudio as part of the course and using it for most of the examples. Excel is used for one of the examples and basic knowledge of excel is assumed.

Who should buy this course?

    • MBA graduates or business professionals who are looking to move to a heavily quantitative role
    • Engineers who want to understand basic statistics and lay a foundation for a career in Data Science
    • Analytics professionals who have mostly worked in Descriptive analytics and want to make the shift to being modelers or data scientists
    • Folks who've worked mostly with tools like Excel and want to learn how to use R for statistical analysis
 
Discussion
 
Provided by
L

Loonycorn is us, Janani Ravi, Vitthal Srinivasan, Swetha Kolalapudi and Navdeep Singh. Between the four of us, we have studied at Stanford, IIM Ahmedabad, the IITs and have spent years (decades, actually) working in tech, in the Bay Area, New York, Singapore and Bangalore.

Show more

Invite friends and earn upto 20% of all orders placed by them.

Earn by sharing url

Share the link:

COPY


  kachhua
Help & Support Request a Callback Call us on | India : +919662523399/66